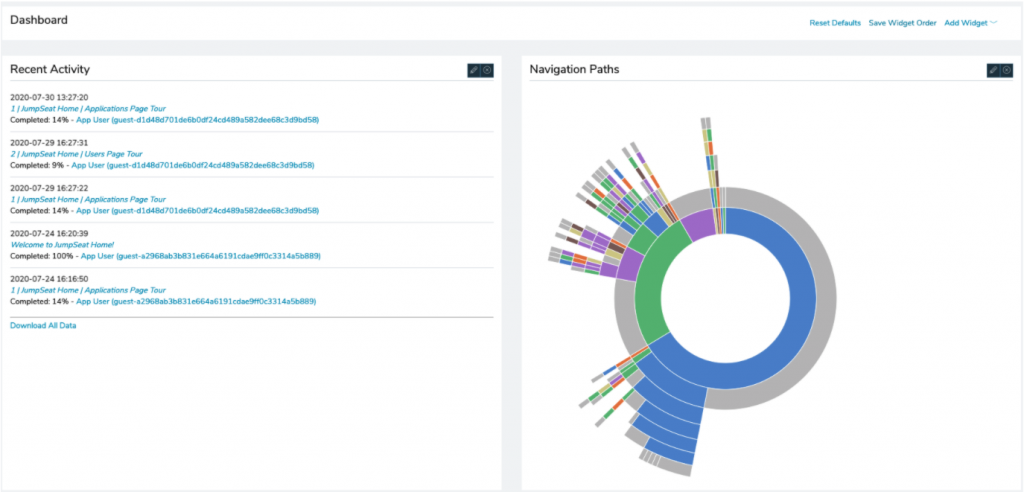
The application dashboard is the first page you’ll see after selecting an application from the JumpSeat Home landing page. Here, you can find a plethora of useful information about user activity on your connected application.
Information is organized into widgets, which are modular data visualizations. To learn more about widgets and how to customize your dashboard, click here.
What insights are available?
- Recent Activity
- Shows the most recently taken guides, who took them, when they took them, and how far through the guide they progressed
- Top Users
- Shows a “leaderboard” of the most active JumpSeat users in your application and how many guides they’ve taken
- Top Guides
- Shows a list of the most popular JumpSeat guides in your instance and how many times each of those has been taken
- Guides Started
- A bar graph that shows guide starts over time- this can be filtered to show data for different timeframes
- Site Activity
- A line chart that shows general user activity in the connected application over time- the chart can display page visits, daily users, and daily sessions
- Navigation Paths
- This data visualization provides insight into how users leverage JumpSeat your connected application- where they start, where they stop, and where they go in between
- Total Visits
- Tracks how many visits a specific page in your connected application gets
- Missing Steps
- Provides a log of missed steps from your JumpSeat content so any configuration issues can be easily identified and resolved quickly
