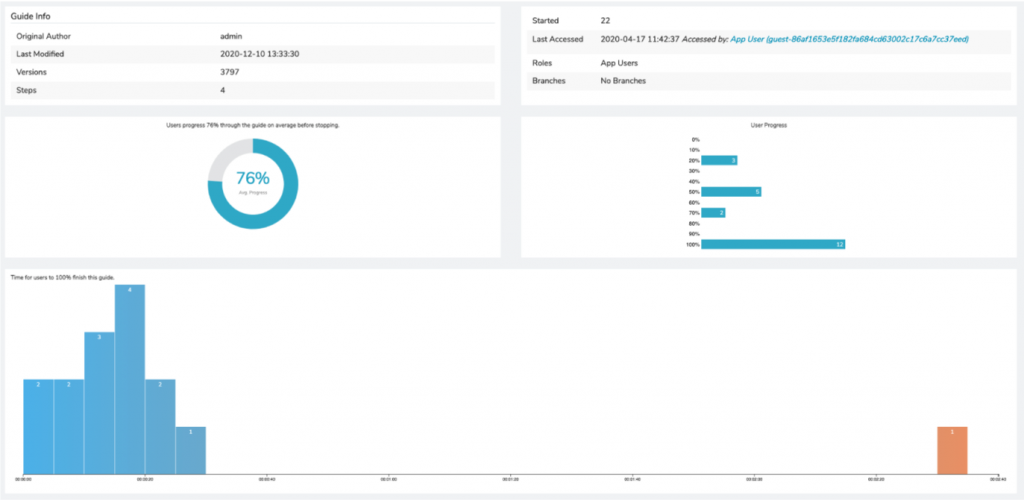
To view individual guide reports:
- Navigate to an application dashboard – look for the pie chart icon
- Scroll down to the Users table (it’s all the way at the bottom)
- Click on the “Guides” tab at the top of the table
- Locate the guide you want to learn more about, and click the “VIEW” button in its row
On the Guide Analytics page, you can find:
- Basic Guide information (author, last modified date, versions, number of steps, times started, last accessed, roles, and branches)
- Average user progress (pie chart)
- User progress (bar graph)
- Time for users to 100% complete the guide (bar graph)
- Step completion % (per step, line chart)
- Median time spent on each step
- Missing steps (table)
- User Progress (table, shows who has completed a guide, how many times, and how far through that guide they’ve gotten)
