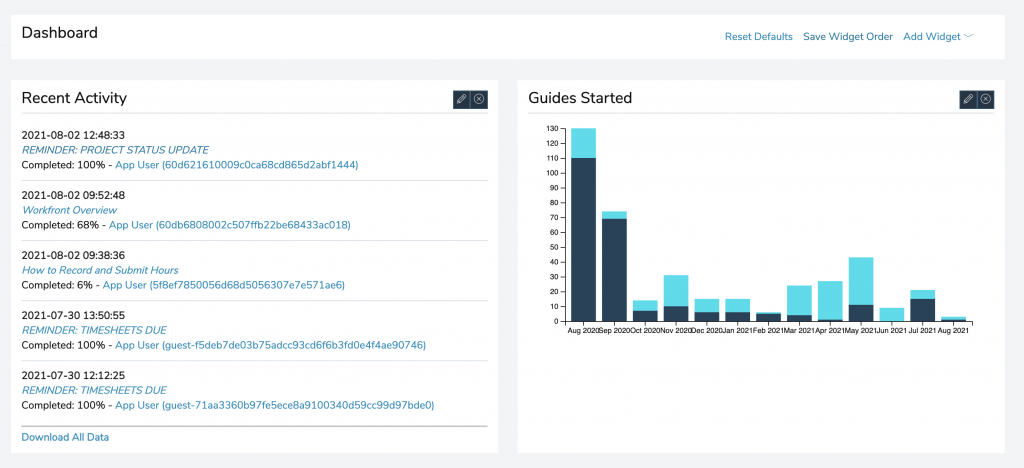
JumpSeat provides analytics that have been designed to help you gain high level insight about users and guides in hosted applications. Analytics in Jumpseat can be accessed by:
- Select an application by clicking the application title on the home page.
- The application opens up to the Analytics page, can also be found by clicking the pie chart icon on the left side toolbar in JumpSeat.
- At the top of the application analytics page is an overview of the number of users, roles, pathways and guides.
- Below this is a leadership of systemwide recent activity, most active users, and most completed guides.
- Below this are two graphs. The first is a line graph measuring the number of steps taken over time. You can select the time frame that the chart displays.
- The second graph shows the number of page views over time.
- Below this section is an area with two tabs: Users and Guides. Under the users tab is a report table where you can view the high level data of individual users including name, email address, creation date, last login date, and admin status.
- In the Guides tab, you can view a table of guides within the application with some high level statistics including guide name, status, version, and number of times it was started and completed.